Array
How does a nonprofit prove that it makes the most of every dollar donated? How does a charitable organization convince its supporters that it deserves more funding? How does an agency measure the social impact of its technology investment?
These are questions worth answering. And some nonprofits already have some pretty compelling answers with help from a new TechBridge tool specifically designed for 501(c)(3) organizations. This innovation allows nonprofits to report meaningful outcomes to their funders and board leadership — key audiences in supporting NPO missions. Early adopters have called this new TechBridge ROI Calculator tool an approval game-changer.
For example, the Atlanta Mission (a large network of homeless shelters) won board approval and raised 100% of needed funding for a major overhaul to its donor management system … that is, once we calculated the project’s value at more than $100,000 in cost savings annually. That translates into a gobsmacking return on investment (ROI) of 216% over 5 years. With these savings and the potential for improved fundraising results, the Atlanta Mission verifies its operations and its decisions and can do even more.
Another early adopter, Rainbow Village (a nonprofit transitional housing program for families in Duluth, Georgia and the recipient of the annual TechBridge technology grant) wanted to prove that its model for moving homeless families out of the crisis was highly successful and repeatable and that its investment in IT systems was paying off. Rainbow Village believed our ROI Calculator could create reports to its board and funders to remove doubt that kept creeping into conversations about client service, improvement, and growth. Could technology save the day? The ROI Calculator demonstrated how the technology investment provided key performance measures, improved fundraising performance, implemented Rainbow Village’s strategic plan, and captured other measures, saving enormous amounts of time, effort, and energy. All of this allowed Rainbow Village case managers to spend more time interfacing with clients. The ROI helped win approval, giving this amazing nonprofit the additional funds needed to implement a customized Salesforce-based client management system. The new system is projected to save Rainbow Village $18,900 per year through reduced manual administration required to generate the client metrics used in its decision-making.
Birth of an Application (Necessity Is the Mother of Invention)
In helping other nonprofits, we discovered a missing tool in our own technology toolbox. As a nonprofit founded to help other nonprofits tap into smart technologies, we have helped hundreds of nonprofit organizations do more with technology. However, we missed something important. We have implemented inventory technology tools to help food pantries manage food donations and aid shelters in managing available beds. We help keep runaways linked to other teens and to safe-house caseworkers. We link nonprofit partners together to share data. But we hadn’t created a tool to measure how technology matters to these nonprofits. Technology is invisible; how do we prove its worth?
Executive directors needed a way to back up their assertion that better technology allowed them to make a bigger impact. To help, we needed to standardize how its nonprofit clients capture and communicate the outcomes of investing in our technology solutions. Basically, the ROI Calculator takes the input (dollars invested) in a technology project and calculates the ROI in savings (dollars and hours saved) and the number of additional clients served. This tool will soon be integrated into all our technology projects.
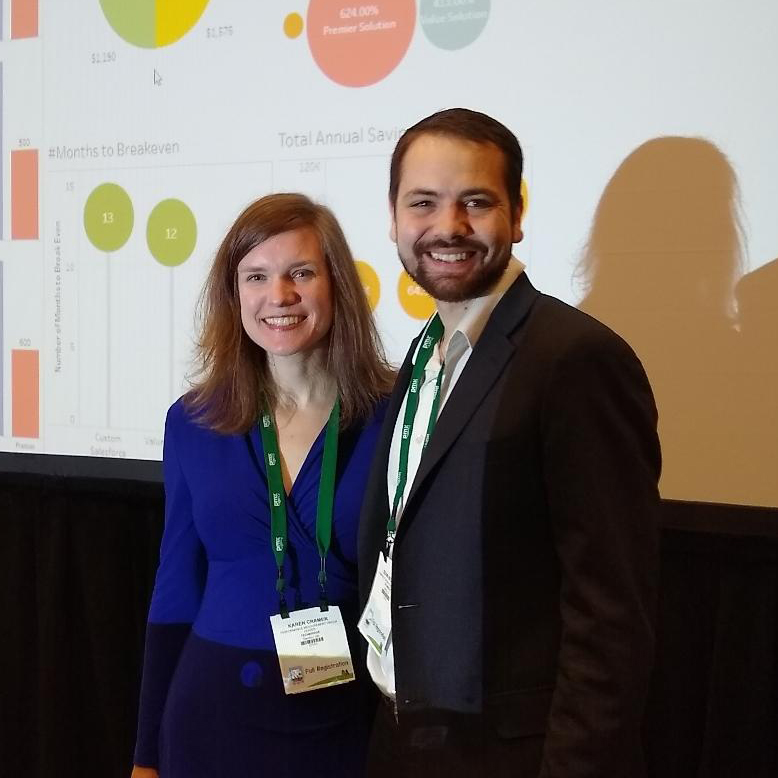
We are thrilled to share our nonprofit clients’ success stories and our own journey in measuring the impact of technology investments. This innovation is continuing to grow and evolve. Thanks to a collaborative project with a Georgia Tech student group, Epic Intentions, we have developed the ability to visualize outcomes from the ROI Calculator using Tableau dashboards, both at the individual nonprofit level and aggregated geographically by zip code in our three major communities (Georgia, Alabama, and Tennessee). In March, we co-presented with Los Angeles-based Mercy for Animals and Chicago-based National Immigrant Justice Center on the ROI Calculator at NTEN’s Nonprofit Technology Conference (NTC) event.
Let us help your nonprofit become part of the technology innovation ecosystem. We are working to translate the direct outcomes of technology investments (dollars saved, hours saved, and clients served) into the wider lens of the estimated economic impact of those outcomes to society. Consider the increase in the number of homeless families the Atlanta Mission or Rainbow Village serves, tying that metric into an evidence-based academic study that can translate it into economic impact metrics, such as community savings through the reduction of uninsured emergency medical costs. The process is complex, but we are beginning to achieve real results by leveraging existing tools such as the Low Income Investment Fund’s (LII) Social Impact Calculator, as well as investing R&D funding into our own technology, which we hope to bring to market later this year.
Big yawn, right? More calculators for nonprofits! But what questions would a Social Impact Calculator answer for nonprofits, their executive directors, and their board members? Questions like:
- Are shelters having a notable positive impact on chronic homelessness in Atlanta?
- Are these homeless the same people we housed one year ago?
- What’s happening in food security? Are foodbank clients getting on their feet again?
- If so, is it only a short-term success or they are returning months later?
- Or are they finding paths to stability?
We know nonprofits do good work every day, let’s use a tool to explain what differences they make.


